 About Us
 Services
 Sectors
 Case Studies
 Blog
Blog Contact
SQLBits 2017: A Look Back
Date: Friday, February 16, 2018
This time next week Dominic & I will be absorbing the latest in data development at SQLBits in London.
Last year I went with the aim of improving my understanding and knowledge of Microsoft’s Power BI. Through the tutorials and training, I finally felt like I had a handle on the future of Business Intelligence and data reporting. What I picked up at the conference was not only a sense of achievement but an idea of what we will all be seeing on our screens in the future. Dashboards, showing interactive visualisations, with live updates from multiple data sources. A one stop shop for answers.
My key takeaway was in fact on my last day, during an introduction to data storytelling by Stacia Varga. Whilst we can get excited by new technology, bright colours, and interactive features; as report writers we need to ensure that the data tells the reader what they need to know. Data can be misread or misrepresented by the way it is displayed.
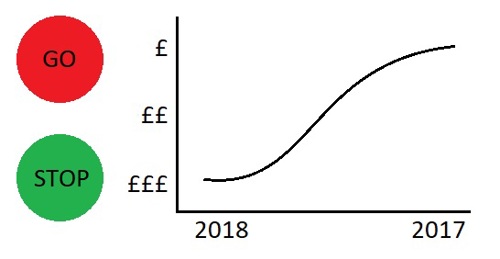
Our brains make automatic assumptions before we’ve even read the title. We see red as bad, green as good, a line graph rising is a positive indicator, one descending is negative. We assume information should be read left to right (In Europe) and that time goes from past to present. When creating reports we must take into account these automatic assumptions and not make our data counterintuitive.
Data must be able to tell it’s story without the need for it’s creator to explain it!
With all that I learned, I’m really looking forward to what this year’s conference will bring.
Posted under: events Learning Databases Business Intelligence sqlbits sql
Browse all tags- Share:
-


