 About Us
 Services
 Sectors
 Case Studies
 Blog
Blog Contact
Is fragmented, ‘siloed’ business data holding your business back? 5 ways Power BI can enhance your business intelligence
Date: Saturday, May 15, 2021
Do you really know how your business is performing?
If your business data is fragmented across excel spreadsheets, your CRM, an ERP system, your accountancy software (…this list goes on and on), then you don’t have the visibility you need to make informed decisions and drive productivity, innovation and efficiency.
In other words, your data is not intelligent. It may be accurate, but it is not reflecting the whole picture.
There’s a far better way to access the information you need. It’s called Business Intelligence and it means the ability to connect and integrate fragmented business data into dynamic reports which are presented as beautiful, simple dashboards.
Village Software are specialists in helping organisations such as Rutland Cycling become data driven. [See Here how Rutland Cycling, have powered their growth through data.]
Rutland Cycling are not alone. Many high-growth businesses place Business Intelligence (BI) at the centre of their growth strategy. This is because they recognise that data holds the key to identifying how the business is performing in real-time, where they are doing well, where they are not doing well, where they need to improve, how they can improve, and how to accurately plan and forecast.
Data is all-permeating throughout a business – sales data, financial data, HR data, operations data…it all tells a story. And what better way to tell a story than through visuals that bring it to life.
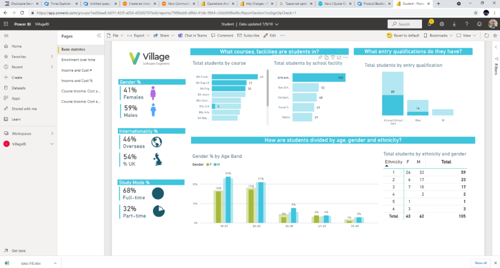
Example: Power BI dashboard showing customer analysis
Pull your business data into a single dashboard view
Here we take a closer look at Microsoft’s BI solution, Power BI. As a Microsoft Gold Partner, Village Software empower organisations to connect and integrate disparate and fragmented data across various spreadsheet’s, platforms and channels through Power BI, displaying it into a ‘single pane of glass’ dashboard view.
This means:
- No more endless hours spent compiling information for reports.
- No more siloed information that is held in different places across the business which is difficult to access.
- No more ‘gaps’ in understanding the overall picture of what is actually happening.
- No more decisions that are based on partial information and gut instinct.
- No more slow and indecisive decision-making.
Download our e-book, An introduction to Business Intelligence: overcome everyday data issues
Five ways Power BI can benefit your business – and why you need it
There are many benefits of integrating your data using Power BI. Here are our top five
1. Accessible insights in minutes
Power BI enables you to connect all data, from multiple sources into one single-pane dashboard view which presents the information through simple, clear visuals.
Power Bi allows you to connect to different flat files, SQL database, and Azure cloud and even web platforms such as Google Analytics, Mailchimp, Salesforce, Sage, Facebook…the list is endless! Basically, wherever your data is currently stored, the likelihood is that Power BI will be able to integrate with it.
Once Power BI has been set up you can generate reports in minutes and manipulate the data with the greatest of ease through intuitive click and drag functionality.

Example: Power BI dashboard showing employee productivity
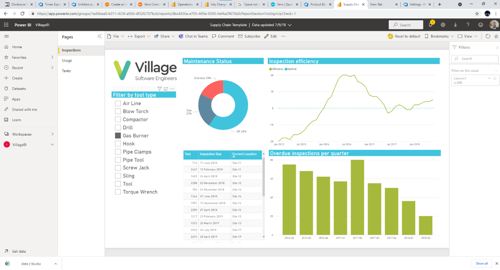
Example: Power BI dashboard showing supply chain analysis
2. Real Time, Innovative Analytics
Keep tabs on your analytics and information as it is happening. By using a multitude of sources like social media, you can keep an eye on real time stats and data as it is being gathered. Not only that but the analytics are easy to understand, and easy to filter and manipulate, meaning you always get the data you need in the format you need it.
Utilising real-time data in this was makes for better insights and more informed decisions.
3. Spot trends, identify current performance, predict and forecast
Another innovative feature that Power BI delivers is the ability to use previous data and current working data to forecast future outcomes.
If you’re eager to see what the future may look like (and which business isn’t!), then Power BI’s analytics and forecasting tools enable you to run ‘what if’ scenarios such as financial forecasting - all without the need for coding.
Power BI’s built-in predictive forecasting models detect things such as seasonality and next reporting period (week, month, year) to predict and forecast future results. These models use historical data to derive likely future results and outcomes in easy-to-digest visuals.
4. Get fast answers to quick questions
Power BI allows the user to type in a natural language question via a search facility to get the exact answers that you are looking for. For example, if you want to interrogate your data but don’t know where to start, or you want to find a particular piece of information, then simply use the Q and A feature to search for it.
By typing in something as simple as ‘what were the number of sales during this quarter of the year’ it can sift through your data to provide potential visuals that could help you find the answer to the question you asked and ultimately help you find what you’re looking for in lightning speed.
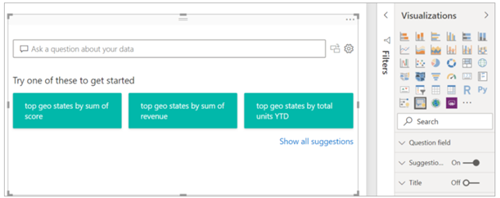
Power BI Q&A Feature
5. Better handling of Azure databases
Power BI is of optimal use to organisations already using Azure, the Microsoft cloud, for storing and managing their data, as it can help you monitor your Azure environment more effectively.
For example, Azure Activity Log is a Power BI template that can generate powerful and insightful reports on your previous 90-day usage, allowing you to identify and visualise patterns in usage as well as issues such as server failures, outages, and maintenance.
Any activity, any usage of the data and any breakdowns can be viewed through Power BI meaning you will never be more in control of your cloud services.
Download our e-book, An introduction to Business Intelligence: overcome everyday data issues
Need our help?
If you'd like some initial advice on how to harness the power of your data, we’d be delighted to talk. Just get in touch for an exploratory chat.
About us
Village Software Engineering design and build remarkable software solutions. We are focused on and committed to powering your business through data – improving your insights, increasing your productivity your efficiency, and reducing your costs.
As a Microsoft Gold Partner, we are experts in helping organisations manage their data, helping you overcome everyday data issues, and transforming your decision-making and insights.
Our team of innovative and skilled developers work across many sectors including manufacturing, education, transportation and logistics, healthcare, utilities and retail.
Our full-service offering includes application development, enterprise integration and business intelligence software solutions that embrace leading edge technologies and methods.
Our curiosity and intelligent thinking help us to deliver quality solutions that don’t just work but work for you.
Download our e-book, An introduction to Business Intelligence: overcome everyday data issues
- Share:
-


